5 Results and Discussion
5.1 Inter-Island Maritime Regular Traffic
Las Palmas province is relatively well-connected by sea; however, its maritime frequencies differ among the islands, its trans-island network of maritime transport covers from cruise ships to local shipping companies. This work focuses on the regular trip companies, since they are the main source of transportation among the islands for tourists and goods. Currently, there are 4 shipping companies, the two major ones almost control all the regular passenger’s market (Naviera Armas and Fred Olsen Express), they use RoPax vessels, although Naviera Armas, the largest company, has also freight operations, while the two minor ones that operates only on the northeastern islands (Líneas Romero and Biosfera Express), have small ferries only for passengers. Fred Olsen Express mostly use catamaran ships, which are ships with a multi-hulled watercraft featuring two parallel hulls of equal size. Moreover, they also have trimarans, which are ships with a multi-hulled watercraft featuring three parallel hulls, making them even more stable than Catamarans. On the other hand, Naviera Armas operates with Catamarans and monohull vessels, while the smaller companies, Líneas Romero and Biosfera Express operates with Catamaran vessels only for passengers in the most northern east routes (Table 1).
The mentioned shipping companies have over seven routes of regular maritime traffic, but only 3 of them exceed 500 thousand passengers per year. These are: Playa Blanca - Corralejo; Santa Cruz de Tenerife - Agaete; y Las Palmas de Gran Canaria - Morro Jable (J. Hernández, 2018; Puertos del Estado, 2021). The frequency of these routes varies mainly depending on the demand; therefore, summer has the highest frequencies and the more frequent routes are the ones with more tourists, such as Corralejo – Playa Blanca, Órzola - Caleta de Sebo, and Sta.Cruz de Tenerife – Agaete (Table 2). It is worth mentioning that those routes’ frequencies are based on the current available schedules of each shipping company.
In 2019, the greatest movement of regular passengers was between Gran Canaria and Tenerife (4.1 million) (from Santa Cruz de Tenerife to Las Palmas or Agaete port), likewise the next routes were Playa Blanca to Corralejo (1.1 million), Las Palmas to Morro de Jable (0.6 million), Caleta de Sebo (La Graciosa) to Órzola (Lanzarote) (0.45 million) and Las Palmas – Arrecife (0.23 million), such as shown in Figure 3, drawn from the information of Puertos Canarios and Puertos del Estado for 2021.
Figure 5.1: Number of passengers in 2019 in the inter-island routes, traveling from or to Las Palmas province ports.
Last years, maritime regular traffic of passengers and vehicles have had a slightly positive trend in most ports, its growth in the islands was 24% from 2015 to 2019. The two main ports in Gran Canaria (Las Palmas and Agaete) registered most travelers and vehicles around the province, which is consistent with the amount of tourism in these islands. Vehicles transported have the same trend, with the greater traffic density between the 2 provincial capitals. In addition, vehicles movement around the islands has grown at 33.7% for the same period, thus the difference between them can be attributable to national tourists and local travelers, since rental car companies do not allow travel between islands (Puertos del Estado 2021) (Figure 4).
Figure 5.2: (A) Movement of regular passengers (by thousands) by port and (B) vehicles (by thousands) by port at ports of Las Palmas province, according to national and provincial Port Institutions.
On the other hand, in 2019, the main port of the islands by far is Las Palmas port, which reached 20.4 million tonnes transported, almost doubling in 19 years. It is followed by Arrecife (1.7 million tonnes) and Puerto del Rosario (1.2 million tonnes) both with similar trends (Figure 5).
Figure 5.3: Tonnes of goods among Las Palmas province ports
5.2 Meteoceanic Conditions Inducing Disruptions
Joint distribution of significant wave height and mean direction is shown in Figure 6 for the complete time series. It is observed that significant wave height (H_m0) reaching the islands is commonly mild and moderate travelling mainly from N-NE sector. In general, more severe wave fields approaching the islands reach at the north and northeast flanks. However, the margins exposed to these episodic severe conditions are those open to the N-NW sector, so that their effects on ports is reduced since there are no ports located at northwest flanks, with exception of Agaete which is partially sheltered by Tenerife, while the eastern ports are sheltered against these conditions. Furthermore, wave fields approaching routes and ports along this flank are energy restricted by fetch limitations imposed by the African coast. For instance, a common practice when there are bad weather conditions with a northern component in the route Las Palmas – Arrecife, is to divert the route on the east side of the islands (Figure 3). In addition, severe wave fields approaching the archipelago with W, SW, or even S component may have major impacts on ships travelling along routes exposed to these unusual wind and wave conditions.
The dominant factor for governing the loads exerted by the waves on vessels is undoubtedly the significant wave height; due to wave energy flux has a quadratic proportionality with this parameter. Nonetheless, the control of aspects such as ship stability and maneuverability of the ship, or passengers comfort requires knowledge on factors as wave period and the directionality (Rawson & Tupper, 2001).
Figure 5.4: Significant height waves (H_mo) and its directionality.
The bivariate distribution of peak period, T_p, and mean direction, shown in Figure 7, has a similar pattern to that observed for the joint distribution of wave heights and direction (Figure 6). It is observed that a remarkable proportion of wave fields arriving to the islands have short periods, indicating locally generated wind seas, but with with a notable frequency waves present peak periods larger than 10 seconds, mainly along routes exposed to wave fields from the N-NW sector, indicating the existence of swell waves, commonly with low steepness. In this sense, it is worth noting that waves with large heights and steepness, and therefore of short period, corresponding to locally generated wind seas, represents adverse type of sea state for navigation, although the directionality of the phenomenon also plays a key role.
Figure 5.5: S Rose of wave peak period (T_p) and its directionality for the whole dataset.
Predominant wind conditions in Las Palmas province are related with the dominance of trade winds, resulting in relatively mild wind conditions blowing mainly from the NNE sector. Previous statement is particularly true for points at open sea, far from the coast, and not affected by orographic effects. Near coast mean wind direction may be deflected while directional variability increases noticeably. Furthermore, a significant decrease in wind speed can be observed in the sheltered side of the islands (Figure 8).
Figure 5.6: Joint distribution of wind speed and direction for the full dataset.
5.3 Case Study Events
The detailed analysis of wind and wave conditions during the disruptive episodes, as well as many other factors related to the characteristics of the vessel affected by these conditions is requiered to know the conditions under which interruption of navigation occurs on a given route. Accordingly, the temporal evolution of wind and waves at each point along a route where a disruptive event was identified has been examined in detail, taking also into account the characteristics of the vessel intended to operate in the maritime route.
Although the analysis was carried out for each one of the identified disruption events, the evolution of the wind and wave parameters during two specific cases is examined in detail below by way of illustrative and representative examples. The selection of these two events has been made on the basis of several storm characteristics, as well as the routes affected.
2010-02-17
The regular maritime routes between Las Palmas de Gran Canaria – Morro Jable, Playa Blanca – Corralejo, Las Palmas – Arrecife y Agaete – Santa Cruz de Tenerife were interrupted on 17 February 2010 due to the presence of a strong atmospheric depression over the islands. The time evolution of wind and wave parameters at point MJ (closet o the Morro Jable Port, south of Fuerteventura) in the route Las Palmas – Morro Jable are shown in Figure 9. It can be observed (Fig. 9a) that the wind speed presents two peaks coinciding with increases of significant wave height to values about 4 m, while wind and waves approaches from the NW-W sector, (Fig 9c). Mean and peak periods attain low values, corresponding to locally generated wind seas (Fig. 9b) and, accordingly, the steepness acquires substantially high values. Under these conditions maritime traffic had to be interrupted in the routes exposed to the effect of high and steeped waves.
Figure 5.7: Wind and wave parameters evolution at point MJ in the route Las Palmas – Morro Jable. (2010/02/17; 4049009_MJ)
2013-12-11
During 2013/12/11 the maritime traffic between Playa Blanca – Corralejo, Las Palmas – Arrecife and Caleta de Cebo – Órzola was interrupted due to an anomalous storm with moderate wave heights (Fig 10a) but considerably low periods (Fig. 10b) and large steepness (Fig. 10c) travelling from the south sector and, as a consequence, affecting the commonly sheltered routes and ports at the most eastern side of the archipelago, as well as the channel between Gran Canaria and Fuerteventura.
Figure 5.8: Wind and wave parameters evolution at point GCCO-2 in the route Las Palmas – Arrecife (2013/12/11).
5.4 Socioeconomic Implications
There are many socioeconomic implications because of the disruption of maritime transport. Beginning from not being able to arrive on time to your destination, this could affect indirectly to the people that is waiting for your arrival, for instance, it could be your family, your job, etc. These disruptions or delays can be even more problematic regarding the transportation of goods, provoking the breakdown of the supply chain and a possible lack of stock in some products, since a great amount of goods are transported by RoPax Vessels. Due to the lack information and the short time, this economic assessment does not take account neither the social impacts nor the interruption of cargo maritime transport, despite they may have great impacts in the socioeconomic field.
Concerning about tourism, when local people spend unplanning time somewhere, they have to postpone other activities and spend unforeseen money to surpass the inconvenience, however it is likely that they travel again, since they are traveling to visit some family or doing business in some neighbor island. On the contrary, in the case of tourists, this may affect their willingness to return to the islands by that mean of transport, or even worst, they may not want to come back at all, since tourists often have reduced days of vacation; they try to plan every aspect of it, therefore the disruption or delay of their plans not only takes their vacation time, but also takes away time to consume at their destination, causing the loss of money for those who make a living from tourism. Since, the archipelago has a tourism-based economy, the economic assessment of disruption of maritime transport was obtained around it.
First, to put it in context, demographic growth has been steadily last decades, going from 1.71 million inhabitants in 2000 to 2.17 million inhabitants in 2020 (ISTAC, 2021). Likewise, it has happened with tourism, going from 13.3 million tourists in 2015 to 15.1 million tourists in 2019, only 13% of that amount were local tourists. As the population is concentrated in the central islands, tourism is also concentrated in the 2 provincial capital islands, however there are a considerable number of tourists in Lanzarote and Fuerteventura. Note that foreign tourists are much more than locals and the population as a whole, which is a measure of how important is tourism in the islands (Figure 11).
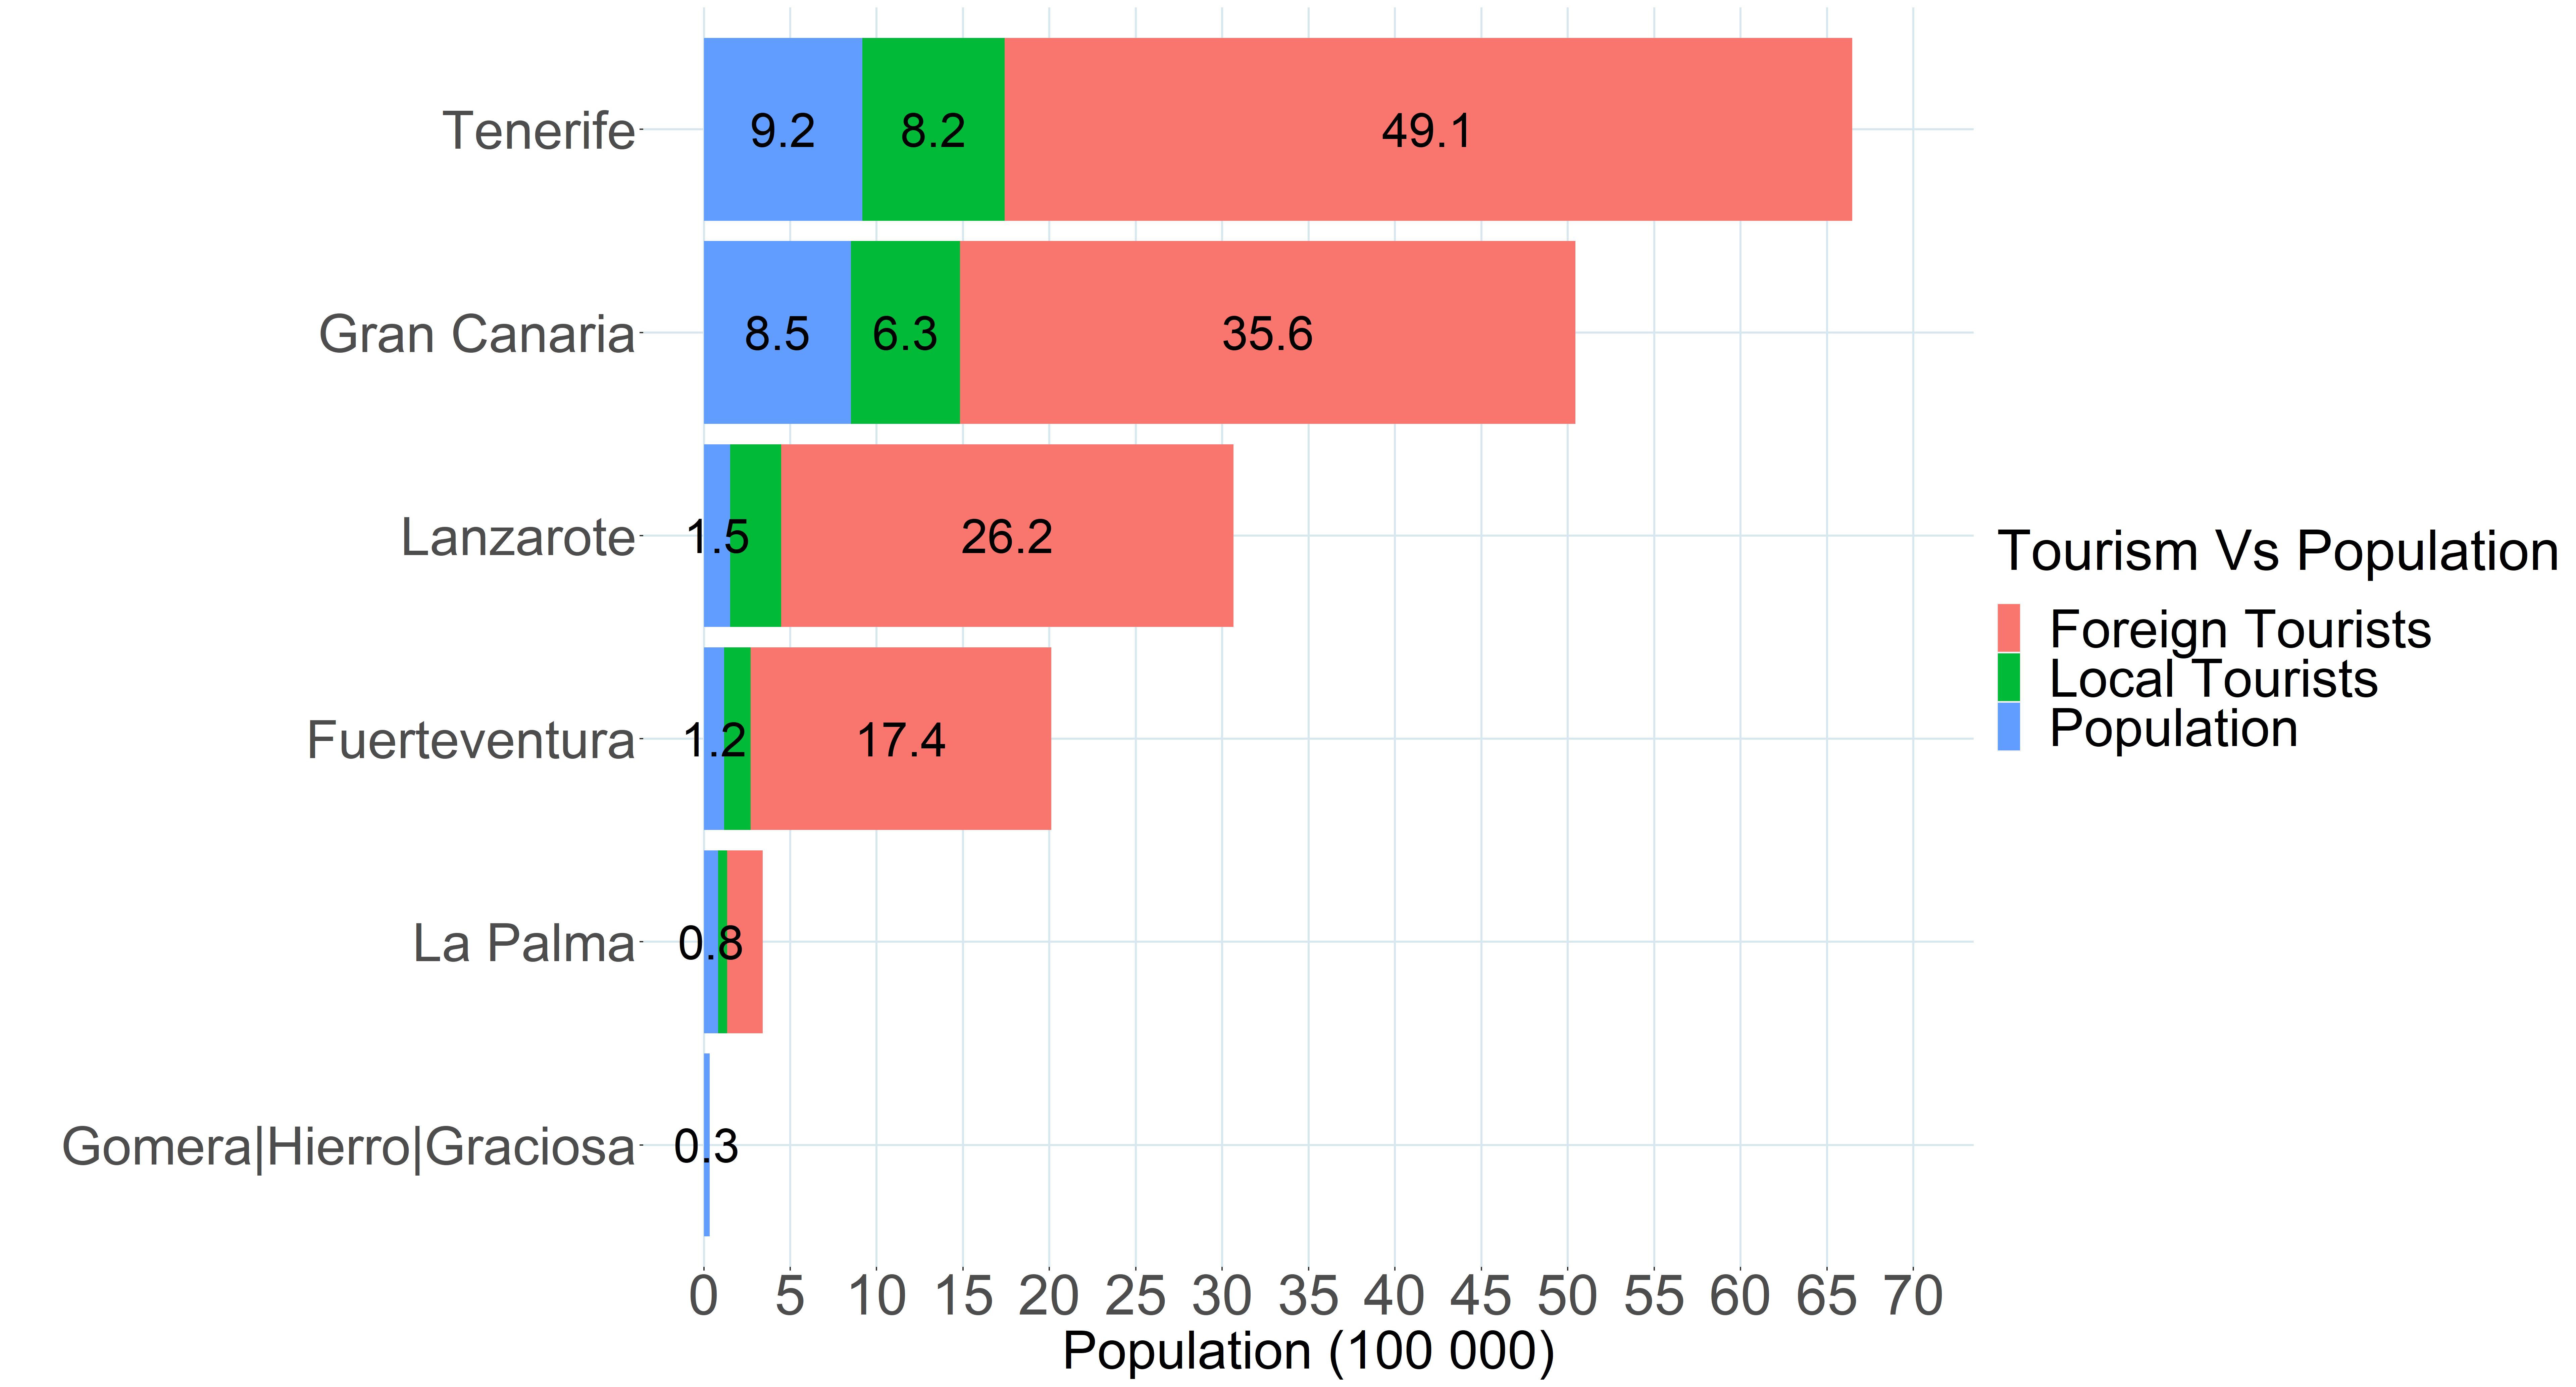
Figure 5.9: Canary Islands tourism and population in 2019 (by hundred thousand) (ISTAC).
Second, it seems that tourism is cyclical, having 2 marked peaks, the highest peak of tourism is at winter (Dec – March), due to many northern Europeans travel to the islands to avoid their winter temperatures. Next peak is on the busy months of summer (July and August), where most people in the world is on vacation. By contrast, the lowest months of tourism are May - April at the beginning of spring, and September at the end of summer, when many people start classes (Figure 12).
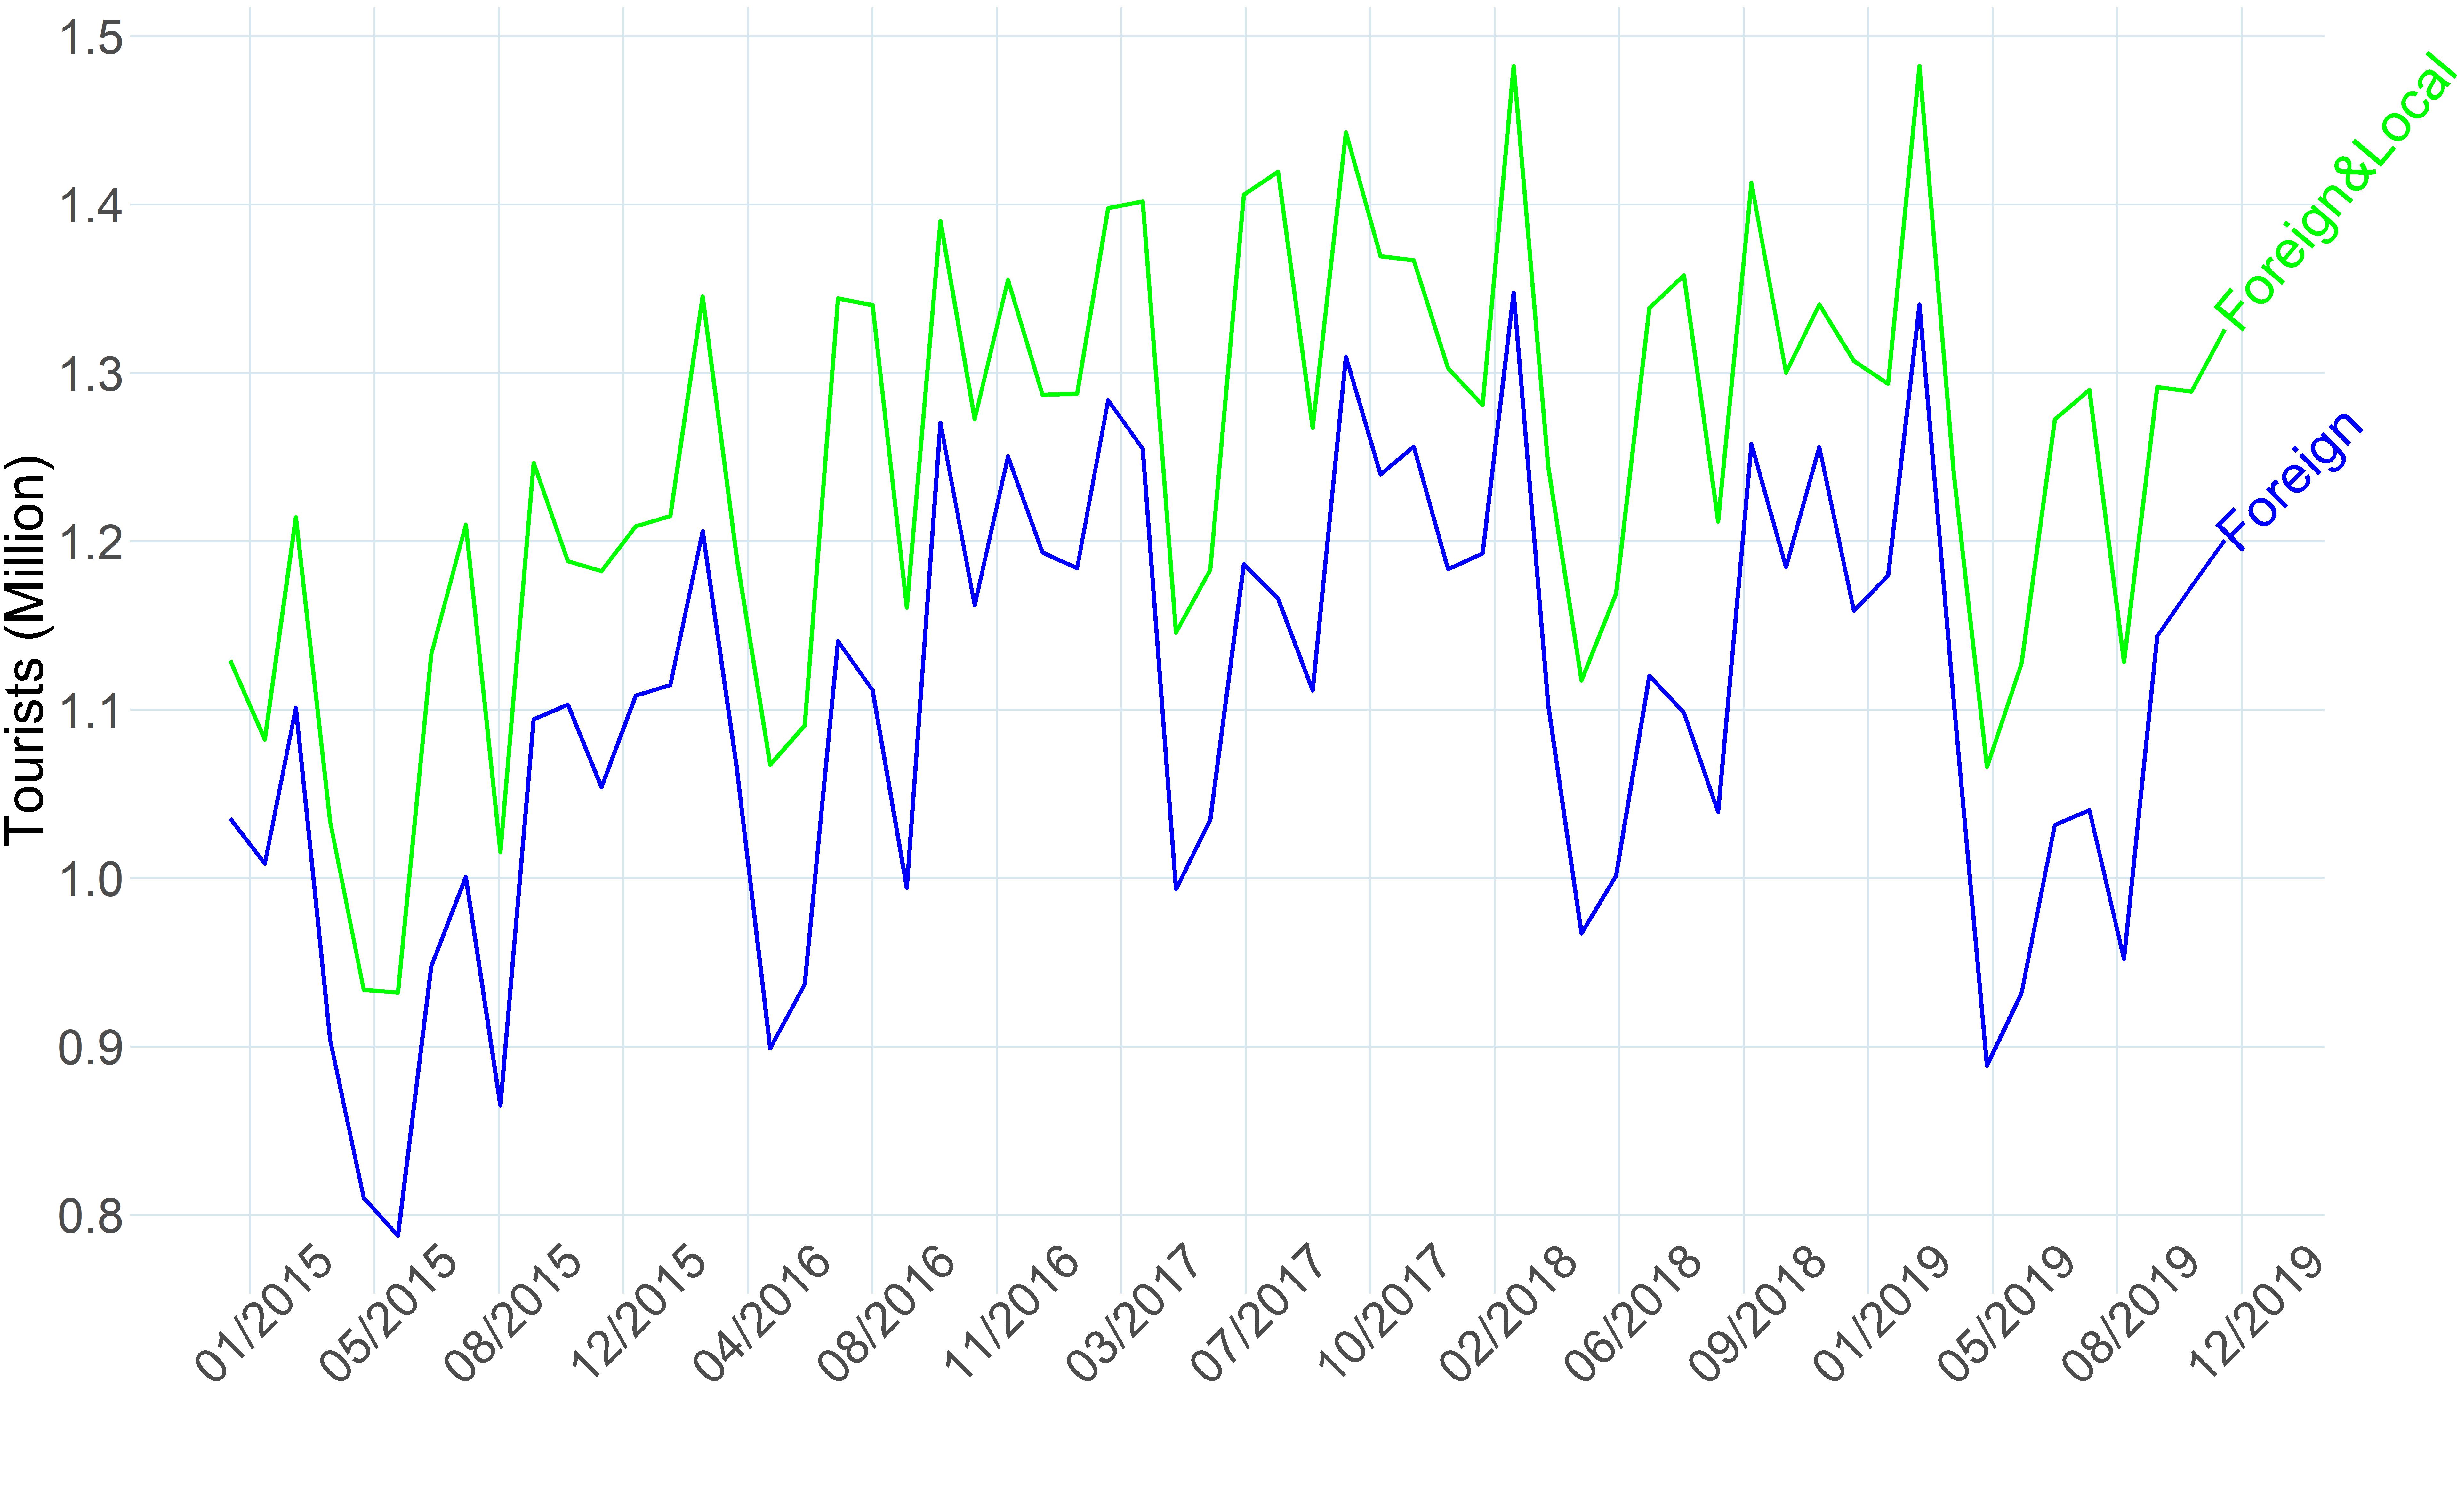
Figure 5.10: Canary Islands seasonal tourism in months from 2015 to 2019 (by million) (ISTAC).
5.4.1 Economic Assessment
The present economic estimate of the disruption of maritime transport was made from a final consumption expenditure approach as mentioned before (See Methodology Section), that is, how much is not being consuming for each hour of delay, detour, or maritime suspension route in a certain island. To estimate this economic value, it was established some assumptions (See Methodology Section). Thus, it was accomplished a monetary value per hour for each month and island. This value tells us that for every hour of delay detour or disruption on a maritime route, tourists are not consuming that amount of money, for instance, the summer busy months (July – August) the number of tourists is higher and their willingness to consume too. Therefore, in August, in case of a maritime disruption or delay involving one of the next islands, Fuerteventura would be losing around € 7 thousands, Las Palmas € 5.5 thousand, Lanzarote € 3.5 thousand, and La Graciosa € 464 every hour (Figure 13). Conversely of what shows the tourism highest peak in winter, these months show a low hypothetical consumption, this may be since this estimation employed only a percentage of people traveling by regular maritime lines, without taking into account tourists who entered by air.
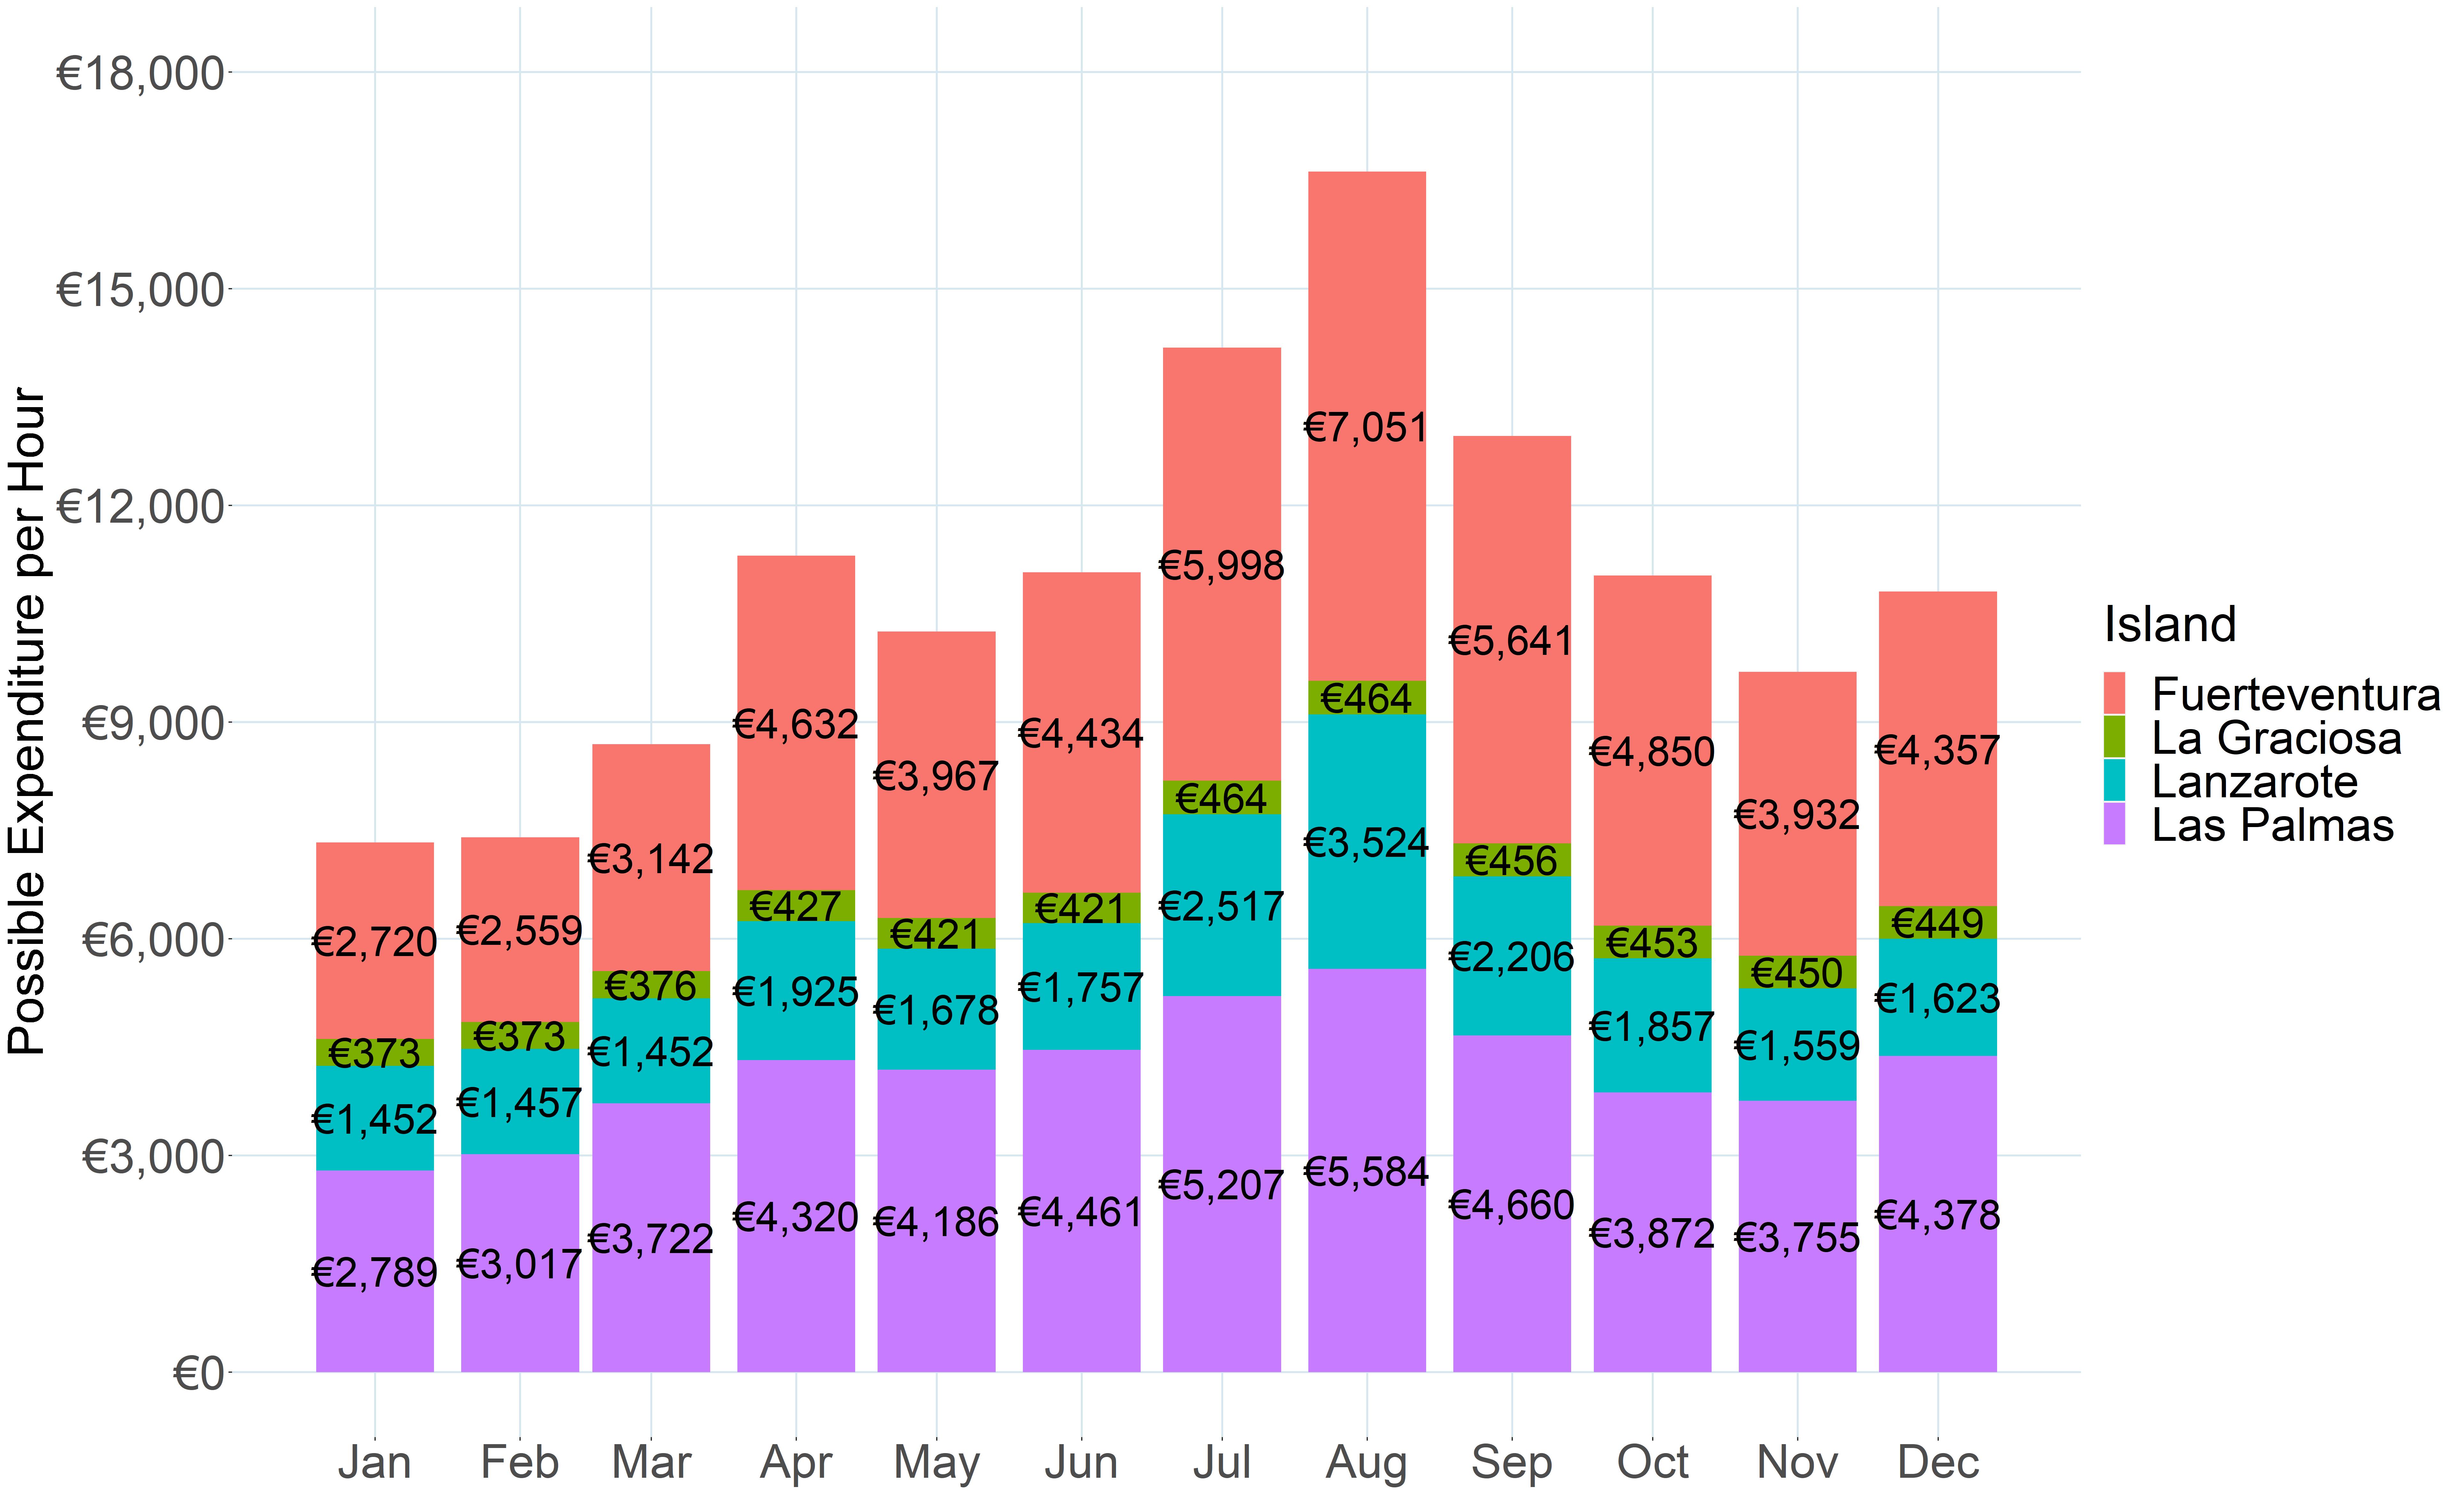
Figure 5.11: Economic Value by each hour of delay detour or suspension by island.